Geographical Space Components
Geographical Space Characteristics
Geography studies the”
humanized space” ( Where a human society is in interaction with the
environment).
Geographical Space is
the perceived space and continuously transformed by the relationship between
its natural, social, economic, politic and cultural characteristics. The geographical space has changed through
time because of natural processes as well as human intervention.
Geographical Space Characteristics´ Components
Each characteristic
is formed by a group of components, for example the ones sown on the chart
below:
Natural
|
Social
|
Cultural
|
Economic
|
Politic
|
* soil
* water
* climate (weather)
* relief
* flora
* fauna
|
*population dynamics
- growth
- migration
* ethnics
- languages
- religions
|
* artistic demonstrations
* cultural globalization
* people´s cultural heritage
|
* economic activities
* trade flows
* communication channels and means
|
* political organization
* international conflict
* international organizations
|
Geographical Space Categories
Diversity means
variety and is the result of the combination of natural, social, cultural,
economic and politic aspects to local,
national or worldwide levels. Climate, relief, natural resources, how
population uses them, etc., produce a
great diversity of the geographical space and that is why there are different regions, landscape, views and
territories with environmental, cultural and economic characteristics that make them unique.
Analysing these components and characteristics we will know if the space we are talking about is urban, rural, semi- rural, etc.
Spatial Analysis Categories
Geography studies the”humanized space” ( Where a human society is in interaction with the environment).
Geographical Space is the perceived space and continuously transformed by the relationship between its natural, social, economic, politic and cultural characteristics. The geographical space has changed through time because of natural processes as well as human intervention.
Analysis of the geographical
space will lead you to understand that you belong to a time and a space and
that we are related with the natural and social changes that surround us. There
are 5 main categories for spatial analysis and they are:
Place or Site: Is the smallest unit of analysis, is any place where
a human can carry out his/her daily activities, it can be a neighborhood, a
park a city. It is a place which creates a feeling of belonging and identity
with a community. (room, house, school, neighborhood, club, park, etc.).
Environment: is the surrounding area of where we live. When we refer
to the physic or biologic characteristics of a place we are talking about the natural
environment, for example the
jungle around the Amazon River. The social or human environment is which
contains cultural or economic demonstrations like Chichen Itzá or te petroleum zone
of Minatitlán. You can also talk about a
rural or urban environment.
Landscape: Is the group of
components perceived by the eyes and that has specific characteristics like
vegetation, climate, relief, etc. It can be natural
(woods, desert, jungle, etc.) or social
or modified (rural, urban, semi urban, etc.)
Region: Is a geographical space characterized by some natural, cultural or
economic elements that differentiates it
from others. For example close areas that share the same climate may form a
climate region (cold, warm, tropical, etc.). We can also talk about agricultural
regions, language regions or cultural regions.
Territory: Is the space that shares the same government. It is
limited by artificial or natural frontiers (state, country, municipality, etc.).
It´s study belongs to national or local scale.
Relationship of Geographical Space Components in a
Place, Environment, Landscape, Region and Territory.
The interaction
between the components results in all the elements (natural, social, cultural,
economic and politic) being related. For example the different climates
influence the variety of natural regions, in the economical activities of each place
and the social and politic organization of its inhabitants.
There is an enormous
diversity in our country and world. This diversity is so big because the
combinations of the components vary and the people who inhabit them gives each
special characteristics. ( Broadway Street in New York, Garibaldi´s Square in
Mexico City, etc. where the demonstration of artistic folklore gives each
a characteristic aspect that distinguishes
them from other places.
The main division form
of recognizing an environment is urban or rural, but urban or rural zones can
be very different according to the country , region territory, etc.
Utility of Graph and Number Scales on maps
http://www.brainpopjr.com/socialstudies/geography/
(link for extra information)
Geographic Space can
be analyzed to
different scales: worldwide, national or local.
A map can show continents, countries, states, and
cities or show the roads and landmarks of a town. It can show routes of a
transportation system, such as bus or subway lines, different landforms and
elevations, different kinds of natural resources, or varying temperatures in a
specific area. A map can also show historical data, such as changes in
population, housing development, or crime. A globe is a map on a round model
that shows places on Earth.
A map key or map legend is a chart that explains what
symbols mean on a map. On many navigational maps, a black dot stands for a
city, a star stands for a state’s capital, and a star inside a circle stands
for a country’s capital. Airplanes stand for airports and black or yellow lines
stand for highways, roads, or streets. Different maps have different symbols,
though many share the same basic symbols.

Many
maps have a compass rose, which is a tool that displays directions. The
cardinal directions are north, east, south, and west. The intermediate
directions are the points in between the cardinal directions: northeast,
northwest, southeast, and southwest.

Many
maps also have a scale, which is a tool that compares distance on a map to
distance on Earth. The scale helps the user figure out real-life distances by
looking at a map. For example, suppose there is a map where 1 inch represents 1
mile. Two landmarks that are 3 inches apart on the map are 3 miles apart on
Earth. Different maps have different scales so you should always refer to the
map key or legend to look for the scale.

Remember
that a map is a visual representation of a much larger area of land. In order
to be useful, a map must by necessity be small enough to be handled by an
individual.
Because
the Earth is round and maps are flat, it is impossible to create a map with a
perfect scale. Some parts of the map will be too large, while others will be
too small. The larger a territory represented by a map, the greater that the
distortions in scale will be.
It
is important that we recognize how to read, understand, and utilize scale as we
examine the various maps that we encounter. There are three common methods used
by map makers to depict scale. These methods are referred to as the graphic
method, the verbal method, and the fractional method.
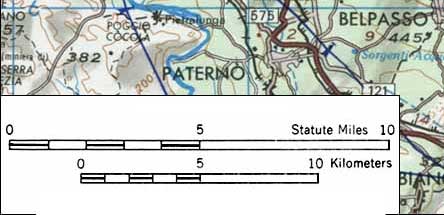
The Graphic Method
A Graphic Scale depicts scale using a line, with
separations marked by smaller intersecting lines, similar to a ruler. One side
of the scale represents the distance on the map, while the other side
represents the true distances of objects in real life. By measuring the
distance between two objects on a map and then referring to the graphic scale,
it is easy to calculate the actual distance between those same items.
There
are many benefits to using a graphic scale. First and foremost, it is a
straight forward, easy way to determine scale. Secondly, if a map’s size is
enlarged or decreased, the scale is also enlarged or reduced, meaning that it
is still accurate.
The
Verbal Method
The verbal
method of depicting scale simply uses words to describe the ratio between the
map's scale and the real world. For example, a map might say something like,
“one inch equals one hundred and fifty miles.” Calculating scale on a map using
the verbal method is easy. Simply measure the distance on the map and then
follow the verbal directions to calculate the actual distance.

The Fractional Method
The fractional
method for portraying the scale of a map uses a representative fraction to
describe the ratio between the map and the real world. This can be shown as
1:50,000 or 1/50,000. In this example, 1 unit of distance on the map represents
50,000 of the same units of distance in the real world. This means that 1 inch
on the map represents 50,000 inches in the real world, 1 foot on the map
represents 50,000 feet on the map.
.

Large Scale Map Versus Small
Scale Map
A map which depicts a small territory is referred to
as a large scale map. This is because the area of land being represented by the
map has been scaled down less, or in other words, the scale is larger. A large
scale map only shows a small area, but it shows it in great detail. A map
depicting a large area, such as an entire country, is considered a small scale
map. In order to show the entire country, the map must be scaled down until it
is much smaller. A small scale map shows more territory, but it is less
detailed.
Map Reading – Measuring Distances
1. Scale:
Objects on the map are drawn to scale: this means the
length is changed by the same proportion as the width.
Example:
The most used are usually 1:50000 (most common) or
1:25000 scale maps.
For a 1:50000 map: 1 cm on the map equals 50000 cm on
the ground (which is the same as saying 1 cm = 500 m or 2 cm = 1000 m).
For a 1:25000 map: 1 cm on the map equals 25000 cm on
the ground (which is the same as saying 1 cm = 250 m or 4 cm = 1000 m).
In map reading we usually measure distances in
kilometres (km) instead of metres (m). 1 km = 1000 m.
Key Ideas:
A grid square is 1 km by 1 km on the ground. This
means a grid square measures 2 cm across on a 1:50000 map or 4 cm across on a
1:25000 map.
A 1:25000 map has twice as much detail as a 1:50000
map, because the grid squares are twice as large.
2. Estimating Distances:
As said above, a grid square measures 1 km by 1 km.
The diagonal distance(from bottom left to top right say) on a grid square is
approximately 1.5 km. A quick method of measuring a straight line on the map is
to count grid squares:
Examples:
• If a straight road covers 4 grid squares on the map,
it will measure approximately 4 km on the ground.
• If the straight edge of a forest covers 3.2 grid
squares on the map, it will measure approximately 3.2 km on the ground.
• If a road runs diagonally across two grid squares it
will measure about 3 km on the ground.
Please note this is a rough method only. It is not
suitable for accurate measurements.
3. Accurate Measurement of Distances
Height = 3 cm
Length = 6 cm
Reduced by 50%:
Height = 1.5 cm
Length = 3 cm
Part A: To measure a straight line between two points:
• Use a ruler and convert the ruler measurement to the
distance on the ground.
• Alternatively, lay the straight edge of a piece of
paper between the points and mark the paper where they are. Transfer the paper
edge to the scale bar at the bottom of the map and read off the distance on the
ground.
Part B: To measure a winding route:
• Use a piece of paper with a straight edge and ‘work’
it along the route on the map.
 +
+
• Remember which mark on your paper strip is the start of the route.
• Don’t take the paper strip off the map – just mark it and rotate it when
you get to a bend on your route.
• When you’ve put the last mark on your paper strip (eg. the end of your route)
lay the strip over the scale bar at the bottom of the map.
• Read off the distance between the start and end marks on your paper
strip.
• You can also use string to measure distances on the map. Knot or mark your
string at the start of the route and work it round in the same way you would
the paper strip. Proper map measurers can also be purchased from outdoor shops.
Practice this method to get good at it. Measuring
distances is a very important
Geographic Coordinates and Time Zones
Latitude and Longitude
Latitude and
longitude lines are use to locate coordinates on the earth or on a map.
In classical
Greece and China, attempts were made to create logical grid systems of the
world to answer this question. The ancient Greek geographer Ptolemy created a
grid system and listed the coordinates for places throughout the known world in
his book Geography. But it wasn't until the middle ages that the latitude and
longitude system was developed and implemented. This system is written in
degrees, using the symbol °.
Latitude
When looking
at a map, latitude lines run horizontally. Latitude lines are also known as
parallels since they are parallel and are an equal distance from each other.
Each degree of latitude is approximately 69 miles (111 km) apart; there is a
variation due to the fact that the earth is not a perfect sphere but an oblate
ellipsoid (slightly egg-shaped). To remember latitude, imagine them as the
horizontal rungs of a ladder ("ladder-tude"). Degrees latitude are
numbered from 0° to 90° north and south. Zero degrees is the equator, the
imaginary line which divides our planet into the northern and southern
hemispheres. 90° north is the North Pole and 90° south is the South Pole.
Longitude
The vertical
longitude lines are also known as meridians. They converge at the poles and are
widest at the equator (about 69 miles or 111 km apart). Zero degrees longitude
is located at Greenwich, England (0°). The degrees continue 180° east and 180°
west where they meet and form the International Date Line in the Pacific Ocean.
Greenwich, the site of the British Royal Greenwich Observatory, was established
as the site of the prime meridian by an international conference in 1884.
How Latitude and Longitude Work
Together
To precisely
locate points on the earth's surface, degrees longitude and latitude have been
divided into minutes (') and seconds ("). There are 60 minutes in each
degree. Each minute is divided into 60 seconds. Seconds can be further divided
into tenths, hundredths, or even thousandths. For example, the U.S. Capitol is
located at 38°53'23"N , 77°00'27"W (38 degrees, 53 minutes, and 23
seconds north of the equator and 77 degrees, no minutes and 27 seconds west of
the meridian passing through Greenwich, England).
Three of the
most significant imaginary lines running across the surface of the Earth are
the equator, the Tropic of Cancer, and the Tropic of Capricorn. While the
equator is the longest line of latitude on the Earth (the line where the Earth
is widest in an east-west direction), the tropics are based on the sun's
position in relation to the Earth at two points of the year. All three lines of
latitude are significant in their relationship between the Earth and the sun.
The Equator
The equator
is located at zero degrees latitude. The equator runs through Indonesia,
Ecuador, northern Brazil, the Democratic Republic of the Congo, and Kenya,
among other countries The equator divides the planet into the Northern and
Southern Hemispheres. On the equator, the length of day and night are equal
every day of the year - day is always twelve hours long and night is always
twelve hours long.
The Tropic of Cancer and The Tropic of Capricorn
The Tropic of
Cancer and the Tropic of Capricorn each lie at 23.5 degrees latitude. The
Tropic of Cancer is located at 23.5° North of the equator and runs through
Mexico, the Bahamas, Egypt, Saudi Arabia, India, and southern China. The Tropic
of Capricorn lies at 23.5° South of the equator and runs through Australia,
Chile, southern Brazil (Brazil is the only country that passes through both the
equator and a tropic), and northern South Africa.
The tropics
are the two lines where the sun is directly overhead at noon on the two
solstices - near June and December 21. The sun is directly overhead at noon on
the Tropic of Cancer on June 21 (the beginning of summer in the Northern
Hemisphere and the beginning of winter in the Southern Hemisphere) and the sun
is directly overhead at noon on the Tropic of Capricorn on December 21 (the
beginning of winter in the Northern Hemisphere and the beginning of summer in
the Southern Hemisphere).
The reason
for the location of the Tropic of Cancer and the Tropic of Capricorn at 23.5°
north and south respectively is due to the axial tilt of the Earth. The Earth
is titled 23.5 degrees from the plane of the Earth's revolution around the sun
each year.
The area
bounded by the Tropic of Cancer on the north and Tropic of Capricorn on the
south is known as the "tropics." This area does not experience
seasons because the sun is always high in the sky. Only higher latitudes, north
of the Tropic of Cancer and south of the Tropic of Capricorn, experience
significant seasonal variation in climate.
Prime Meridian
While the
equator divides the Earth into Northern and Southern Hemispheres, it is the
Prime Meridian at zero degrees longitude and the line of longitude opposite the
Prime Meridian (near the International Date Line) at 180 degrees longitude that
divides the Earth into the Eastern and Western Hemispheres. The Eastern
Hemisphere consists of Europe, Africa, Asia, and Australia while the Western
Hemisphere includes North and South America. Some geographers place the
boundaries between the hemispheres at 20° West and 160° East so as to not run
through Europe and Africa. The Prime Meridian and all lines of longitude are
completely imaginary lines and have no significance with regard to the Earth or
to its relationship with the sun.
Links for more information:
Links for more information:
Time zones
Time zones
are areas of the Earth that follow the same definition of time. Formerly,
people were using apparent solar time, resulting in the time differing slightly
from town to town. Time zones partially rectified the problem by setting the
clocks of a region to the same mean solar time. Time zones are
generally centered on meridians of a longitude that is a multiple of 15º;
however as the map below shows, the shapes of time zones can be quite irregular
because of boundaries of countries. All time zones are defined relative to Coordinated
Universal Time (UTC), the time zone containing London. (Underlined words take you to links for further information )


Location of Places and Time Zones on
Maps
To exactly locate a place in the world is done using
the geographical coordinates given by its latitude, longitude and altitude.
To know the time of a place located at the east you
need to add an hour for each 15° of longitude (to the west- to the left in a
map) and to know the time of a place located to the west you need to subtract
an hour for each degree (to the east – to the right on a map).
Definitions:
Croquis: simplified form of a small
area map.
Plan: Small representation of
portions of geographical space ( city, neighborhood).
Map: Earth´s surface representation.
Atlas: Collection of maps.
Globe: 3D Representation of Earth
MAP PROJECTIONS

Representation
|
Description
|
Advantages
|
Disadvantages
|
Illustration
|
Cylindrical (Robinson , Mercator and Peters projections are all cylindrial projections.)
|
A cylindrical projection map is the most common type of map.
Mathematically projected on a Cyllinder conceptually tangent to the Equator.
Best Uses: To represent all earth.
Best Uses: To represent all earth.
|
Areas close to the equator have very little distortion. All
areas on the map are proportional to the same areas on the Earth. Directions are
reasonably accurate in limited regions. Distances are true on both standard
parallels. The projection works well for mapping areas that extend equally
from the center point, such as North America
|
The closer to the poles that one travels, the more distorted the map becomes.Greenland appears to be many times larger than it really is.Areas
and shapes
of large areas are distorted. Distortion increases away from Equator and is extreme in polar regions. Map, however, is conformal in that angles and shapes within any small area (such as that shown by USGS topographic map) is essentially true. |
|
|
Conic
|
A conic projection map is created by placing a cone shaped screen on a globe. The resulting projection is more accurate than the cylindrical projection map discussed above. However, the further we travel down the map, the more distorted and less accurate the map becomes. Mathematically projected on a cone secant at two standard parallels.
Parallels are semi-circles and meridians get all together at the poles.
Best Uses: To represent parts of the world, speially middle latitudes.
|
Any straight line on the map is a rhumb line (line of constant
direction). Directions along a rhumb line are true between any
two points on map.Good for navigation.
|
Distances are true only along Equator. Areas and shapes of
large areas are distorted. Distortion
increases away from Equator and is extreme in polar regions. Map, however, is
conformal
in that angles and shapes within any small area. The map is not perspective, equal area, or equidistant.
A rhumb line is usually not the shortest distance between points. |
 |
|
Azimuthal (Planar)
|
A plane projection is created by placing an imaginary screen directly above or below a globe. The image that would result is called a plane projection. This type of map projection is not commonly used.
Best Uses:
-Equatorial: To represent eastern and western hemispheres.
- Polar: For representing Artic and Antartic areas.
|
It has the useful properties
that all points on the map are at proportionally correct distances from the
center point, and that all points on the map are at the correct azimuth
(direction) from the center point.
|
Distances and directions to all
places are true only from the center point of projection. Distances are
correct between points along straight lines through the center. All other
distances are incorrect. Distortion of areas and shapes increases with
distance from center point.
|  |

Mercator´s Projection: Exagerates surfaces over 80° latitude. Polar continental zones look bigger than they really are.
Robinson´s Projection: Pseudo-cylindrical projection in which continents appear longer but show more precise dimensions. Shows good shape of continents and oceans.
Peter´s Projection: Its advantage is to show a more realistic dimension of continents, with less distortion at middle latitudes, but deforms equatorial and polar zones.
There are two other common forms of representing the Earth:
Mollweide: Has and elliptical shape and areas look very deformed. Used to represent exactly zones close to Greenwich meridian.
Goode: Oceans are very deformed. Maintains good shape of continents but oceans anre very deformed.
 Mercator
 Peters (Peterson)
 Robison
Comment: Which is more accurate and what kind of projection each is? (cylindric, conic or planar)